Сu (д. е.) = d60 / d10
Сu is a classification indicator, the value of which can be used to define the heterogeneity of the soil granularity and its suitability for construction needs.
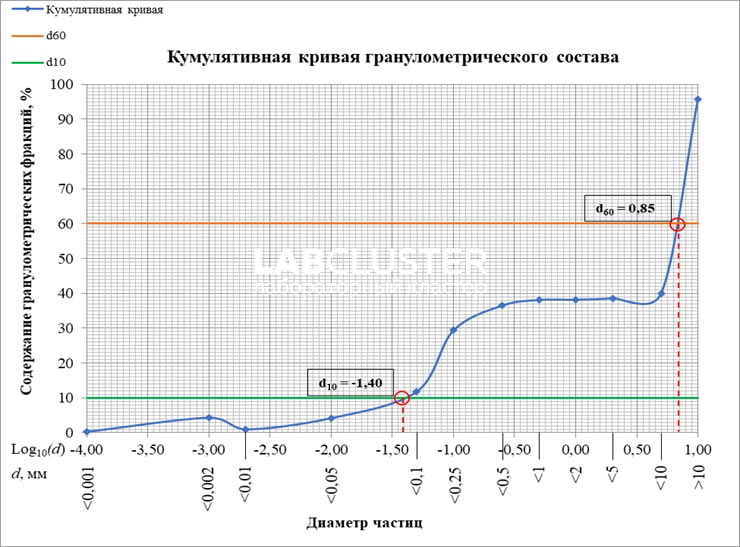
The most convenient way to determine Сu is to use the cumulative curve of the soil granulometric composition, which is its graphic image. To plot the cumulative curve on the ОY axis, the content of granulometric fractions is set in cumulative %, and on the OX axis – decimal logarithms of the fraction diameter. Plot the cumulative curve of the granulometric composition, summing the content of all fractions. From the intersection points of the lines corresponding to the 60% and 10% content of fractions of the cumulative curve, the perpendiculars on the axis of the OX are set and the values of logarithms of the diameters of fractions are found. To convert the logarithm to the value of the fraction diameter, raise the base of the decimal logarithm to the power corresponding to the value of the found logarithm. Сu is calculated.
In accordance with table B.10 s. B.2.3 GOST 25100 sandy and coarse-grained soils are divided into varieties according to the value of Сu. When the Сu value ≤ 3, soils are classified as homogeneous, and when the Сu value ≥ 3, soils are classified as heterogeneous.
In addition, the Сu of soil can be defined by the shape of the cumulative curve itself. If the curve of granulometric composition has a steep slope, the soil is described as homogeneous, well-sorted or mono-dispersed. If the curve has a gentle slope - the soil is characterized as heterogeneous, poorly sorted, it is called multi-grained or polydispersed. Between monodispersed and polydispersed soils, there are transitional subtypes characterized by corresponding forms of cumulative curves. For example, a curve may contain steep or flat sections. Steep sections correspond to an increase in the content of fractions of a certain size, while flat sections correspond to a low content of fractions. In this case, the soil is characterized as mixed, multi-grained. In the figure shown, the curve characterizes an inhomogeneous polydispersed soil (Сu = 178).


